
IRAN FLOW
Iran Capital Flow
The Iran map shows direct or inferred relationships among equities, leverage, gold, silver, fixed income, dollar and cash.
All values in this prototype are illustrative and must not be treated as live before validated data integration.
IRAN FLOWSAMPLE · AS OF —
ObservedDirectly measurable data.
CalculatedDefined ratios or scores.
InferredModel interpretation with confidence and invalidation.
GLOBAL FLOW
Global Capital Flow
The global map studies rotation across regional equities, metals, energy, bonds, dollar and crypto.
All values in this prototype are illustrative and must not be treated as live before validated data integration.
GLOBAL FLOWSAMPLE · AS OF —
Risk RotationRisk assets versus defensive assets.
Regional RotationUnited States, Europe and Asia.
Asset RotationEquities, metals, energy, bonds and crypto.
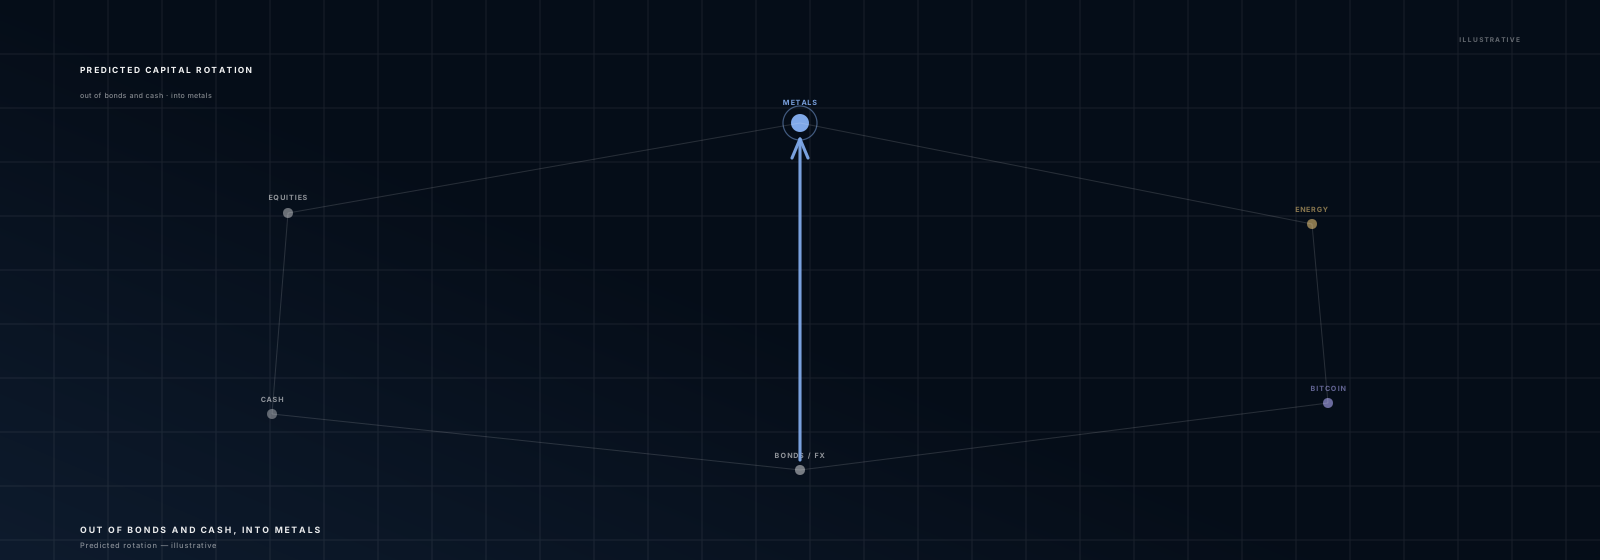
Out of bonds and cash, into metals — the predicted rotation, illustrative.
METHODOLOGY
Why two maps?
Domestic Iranian flow does not follow the same mechanisms as global markets. Separation prevents invalid inference.
1
Data Integrity
Every line has source and observation type.
2
No Decorative Flow
Movement is never drawn only for visual effect.
3
Combined Summary
Only a strategic comparison layer is combined.
FLOW HISTORY
Rotation history
Visitors can inspect daily, weekly, monthly and strategic horizons when valid data exists.
Daily
Enabled after reliable infrastructure.
Weekly
Recommended public default.
Strategic
Long-cycle context.
NEXT STEP